Most Wi-Fi problems are decided before the first access point goes on the ceiling. If the access points are too few, too many or in the wrong places, no amount of configuration afterwards will make the network feel fast. A Wi-Fi heat map lets you see the result on paper first, while changes still cost nothing.
This guide explains what a heat map is, what goes into one and how to read it.
What a Wi-Fi heat map is
A Wi-Fi heat map is your floor plan with a layer of color on top. Each color shows how strong the wireless signal is at that spot: usually green for strong, yellow for acceptable and red or gray for weak.
Signal strength is measured in dBm. The numbers are negative, and the closer a number is to zero, the stronger the signal.
| Signal strength | What to expect |
|---|---|
| -50 dBm or stronger | Excellent. You are close to the access point. |
| -65 to -67 dBm | The usual design target for voice and video calls. |
| -70 dBm | Fine for email and browsing, weak for calls. |
| -80 dBm or weaker | Unreliable. Expect slow speeds and disconnections. |
Predictive and measured heat maps
There are two kinds, and a good project uses both.
A predictive heat map is made before installation. The floor plan is loaded into wireless planning software, the walls are marked with their materials and virtual access points are placed on the plan. The software then calculates the signal in every room.
A measured heat map is made on site. An engineer walks the building with a survey tool that records the real signal at each point. It is used to confirm a new installation, or to find out why an existing network performs badly.
The predictive map is the plan. The measured map is the proof.
What goes into a predictive heat map
- A floor plan drawn to scale for every floor, as a PDF, image or CAD drawing, with at least one known measurement such as the length of a wall
- Wall materials: which walls are brick, concrete, glass or drywall
- Ceiling height, and whether the ceiling is open, false or metal
- Where people sit, and roughly how many devices each area holds
- What the Wi-Fi is used for: video calls, IP phones, handheld scanners or guest access
- Where cables can and cannot go, because every access point needs a cable
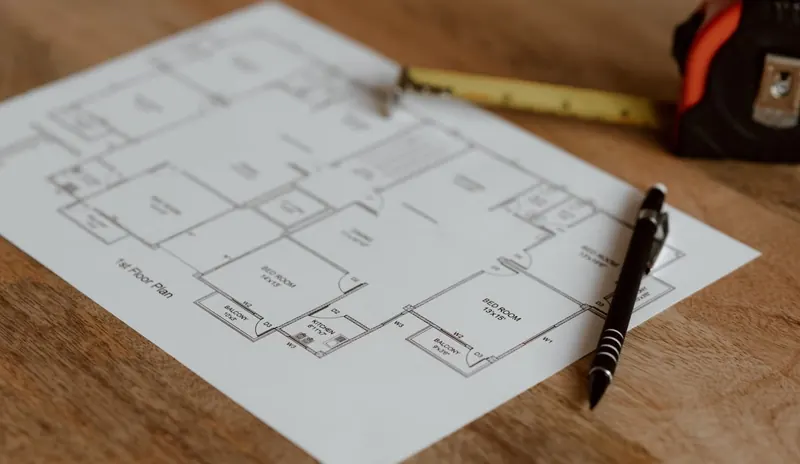
An architect's blueprint is the ideal starting point, because it is drawn to scale and shows every wall.
Why wall materials matter
Every wall takes something from the signal. The loss is measured in decibels (dB), and it adds up quickly: every 3 dB halves the signal power, and 10 dB leaves one tenth of it.
| Material | Typical loss per wall |
|---|---|
| Glass partition, drywall, wooden door | Low: about 3 to 6 dB |
| Brick or block wall | Medium: about 6 to 12 dB |
| Concrete wall or floor slab | High: about 10 to 20 dB, more when thick or heavily reinforced |
| Lift shaft, metal cladding, cold room | Very high: 20 dB or more |
These are planning ranges, not exact values. The real figure depends on the thickness and construction of the wall and on the band: 5 GHz and 6 GHz signals lose more than 2.4 GHz.
Many buildings in Pakistan have solid brick walls and reinforced concrete slabs, which block far more signal than the light partitions of a typical open-plan office. That is why an access point that covers a large hall may not reach the room next door, and why the wall types must be marked correctly on the plan.
What a complete design shows
The heat map is one page of the design. A complete wireless design also includes:
- Signal strength for each band in use, not only 2.4 GHz
- Signal-to-noise ratio, which matters more than raw signal in a noisy area
- Channel overlap, showing where neighboring access points would compete for airtime
- The location, channel and transmit power of every access point
- The number of devices each access point is expected to serve
- A bill of quantities: access points, switch ports, PoE power and cable runs
How to read a heat map
Check the legend first. A map can look completely green if the cut-off is set at -80 dBm. Ask what the design target is. For areas where people take calls, it should be around -65 to -67 dBm.
Look at the 5 GHz map. 2.4 GHz travels further and usually looks better on a heat map, but most business traffic should run on 5 GHz or 6 GHz.
Check the edges. Corner offices, meeting rooms, stairwells and the far end of a warehouse are where coverage usually fails.
Do not ask for more green everywhere. Too many access points at high power interfere with each other. A good design has just enough overlap for devices to roam, and no more.
Remember capacity. A heat map shows coverage. A meeting room or hall with many users may need its own access point even where the map is already green. Our guide to designing enterprise Wi-Fi covers capacity, channels and roaming in more detail.
What a heat map saves
- Rework. Dead zones are found on the plan, not after the ceiling is closed.
- Hardware. You buy the number of access points the building needs, not a guess.
- Cabling. Access point locations are known before the structured cabling goes in, so each cable is pulled once.
- Uncertainty. Everyone can see the expected coverage before the order is placed.
The limits of a predictive map
A predictive map is a calculation, and it is only as good as the information put into it. A wall marked as drywall that turns out to be concrete, metal racking added after the survey or a strong network next door will all change the result.
That is why a design should be verified after installation. The real signal is measured, roaming is tested on a live call, and channels and transmit power are adjusted where needed.
How Arqi Networks uses heat maps
Arqi Networks prepares Wi-Fi heat maps from your building blueprint, plans the access points on them and then installs the network to that design. After installation we test coverage and roaming on site.
We are an official HUAWEI eKit partner and an official Fortinet partner, and we also work with Ubiquiti UniFi, Ruckus, Cisco and other wireless brands, so the design is not tied to one product.
If you are planning a new office, campus or warehouse, or your current Wi-Fi has dead zones, see our enterprise WiFi solutions or send us your floor plan.